| Section 1: Introductory Statistics |
Section 2: Program Model and Literacy Instruction |
Section 3: NES Ethnicity |
Section 4: Economic Demographics |
Section 5: Demographic Comparison |
Section 6: Staffing |
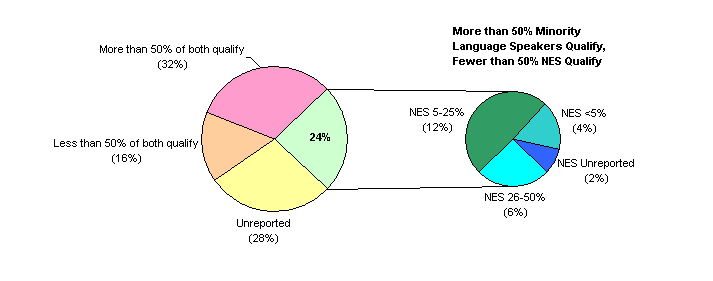
NATIONAL (n=248)
80 (32%) programs report MORE than 50% of both NES and minority language speakers qualify for free/reduced lunch
39 (16%) programs report LESS than 50% of both NES and minority language speakers qualify for free/reduced lunch
69 (28%) unreported
0 programs report MORE than 50% of NES qualify but LESS than 50% of minority language speakers qualify
60 (24%) schools report MORE than 50% of minority language speakers qualify AND:

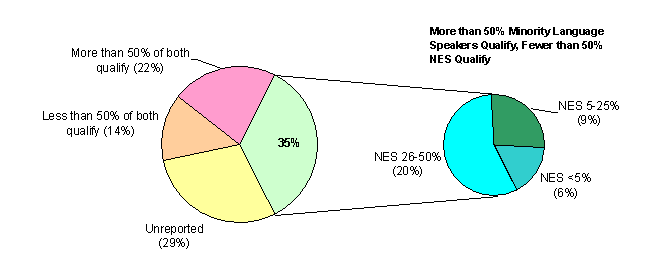
CALIFORNIA (n=86)
19 (22%) programs report MORE than 50% of both NES and minority language speakers qualify for free/reduced lunch
12 (14%) programs report LESS than 50% of both NES and minority language speakers qualify for free/reduced lunch
25 (29%) unreported
0 programs report MORE than 50% of NES qualify but LESS than 50% of minority language speakers qualify
30 (35%) schools report MORE than 50% of minority language speakers qualify AND:

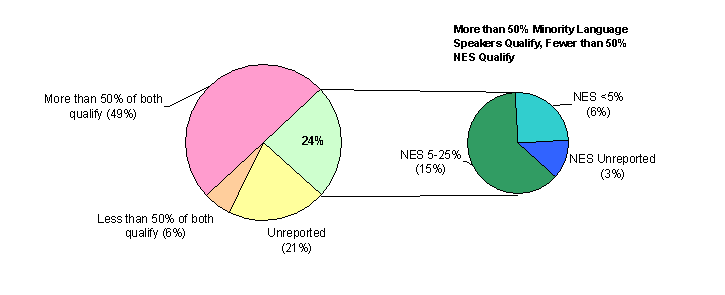
TEXAS (n=34)
17 (49%) programs report MORE than 50% of both NES and minority language speakers qualify for free/reduced lunch
2 (6%) programs report LESS than 50% of both NES and minority language speakers qualify for free/reduced lunch
7 (21%) unreported
0 programs report MORE than 50% of NES qualify but LESS than 50% of minority language speakers qualify
8 (24%) schools report MORE than 50% of minority language speakers qualify AND:

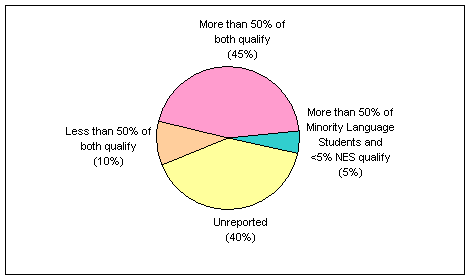
NEW YORK (n=20)
9 (45%) programs report MORE than 50% of both NES and minority language speakers qualify for free/reduced lunch
2 (10%) programs report LESS than 50% of both NES and minority language speakers qualify for free/reduced lunch
8 (40%) unreported
0 programs report MORE than 50% of NES qualify but LESS than 50% of minority language speakers qualify
1 (5%) schools report MORE than 50% of minority language speakers qualify AND:

| Section 1: Introductory Statistics |
Section 2: Program Model and Literacy Instruction |
Section 3: NES Ethnicity |
Section 4: Economic Demographics |
Section 5: Demographic Comparison |
Section 6: Staffing |