Free/Reduced Lunch Eligibility in Two-Way Immersion Programs, by Native Language
As of December 2000
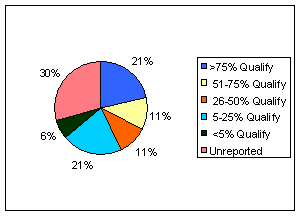
53 (21%) programs report more than 75% of NES qualify
27 (11%) programs report 51-75% of NES qualify
26 (11%) programs report 26-50% of NES qualify
52 (21%) programs report 6-25% of NES qualify
16 (6%) programs report less than 5% of NES qualify
73 (30%) unreported
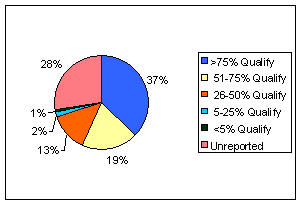
92 (37%) programs report more than 75% of NSML qualify
48 (19%) programs report 51-75% of NSML qualify
33 (13%) programs report 26-50% of NSML qualify
4 (2%) programs report 6-25% of NSML qualify
2 (1%) programs report less than 5% of NSML qualify
68 (28%) unreported
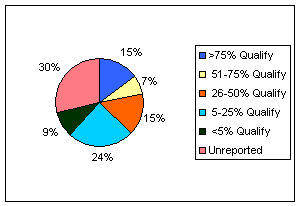
13 (15%) programs report more than 75% of NES qualify
6 (7%) programs report 51-75% of NES qualify
13 (15%) programs report 26-50% of NES qualify
21 (24%) programs report 6-25% of NES qualify
8 (9%) programs report less than 5% of NES qualify
25 (30%) unreported
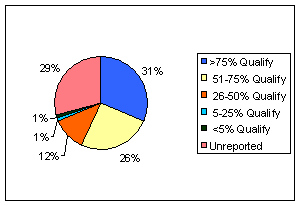
27 (31%) programs report more than 75% of NSML qualify
22 (26%) programs report 51-75% of NSML qualify
10 (12%) programs report 26-50% of NSML qualify
1 (1%) program reports 6-25% of NSML qualify
1 (1%) program reports less than 5% of NSML qualify
25 (29%) unreported
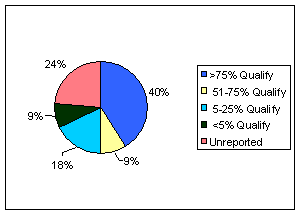
14 (40%) programs report more than 75% of NES qualify
3 (9%) programs report 51-75% of NES qualify
0 programs report 26-50% of NES qualify
6 (18%) programs report 6-25% of NES qualify
3 (9%) programs report less than 5% of NES qualify
8 (24%) unreported
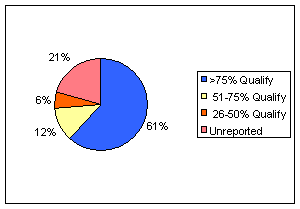
21 (61%) programs report more than 75% of NSML qualify
4 (12%) programs report 51-75% of NSML qualify
2 (6%) programs report 26-50% of NSML qualify
0 programs report 6-25% of NSML qualify
0 programs report less than 5% of NSML qualify
7 (21%) unreported
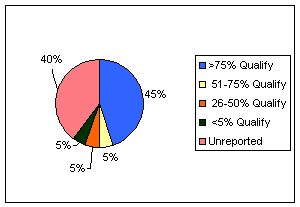
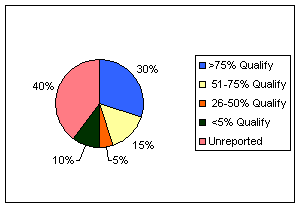
6 (30%) programs report more than 75% of NES qualify
3 (15%) programs report 51-75% of NES qualify
1 (5%) program reports 26-50% of NES qualify
0 programs report 6-25% of NES qualify
2 (10%) programs report less than 5% of NES qualify
8 (40%) unreported
9 (45%) programs report more than 75% of NSML qualify
1 (5%) program reports 51-75% of NSML qualify
1 (5%) program reports 26-50% of NSML qualify
0 programs report 6-25% of NSML qualify
1 (5%) program reports less than 5% of NSML qualify
8 (40%) unreported
