Two-Way Immersion Programs: Features and Statistics

Return to ERIC Digest

Section 1:
Introductory Statistics
Section 2:
Program Model
and Literacy Instruction
Section 3:
NES Ethnicity
Section 4:
Economic Demographics
Section 5:
Demographic Comparison
Section 6:
Staffing


Program Model
As of December 2000

NATIONAL (n=248)
104 (42%) are minority language dominant
85 (34%) are balanced
5 (2%) are differentiated
32 (13%) are middle or high school
22 (9%) are unreported
In CALIFORNIA (n=84)
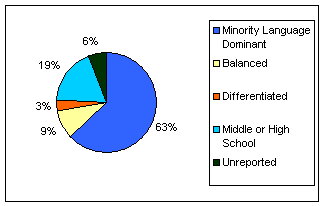
54 (63%) are minority language dominant
8 (9%) are balanced
3 (3%) are differentiated
16 (19%) are middle or high school
5 (6%) are unreported
In TEXAS (n=34)
14 (41%) are minority language dominant
16 (47%) are balanced
0 are differentiated
1 (3%) is middle or high school
3 (9%) are unreported
In NEW YORK (n=20)
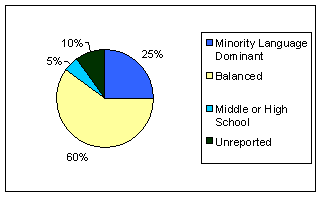
5 (25%) are minority language dominant
12 (60%) are balanced
0 are differentiated
1 (5%) is middle or high school
2 (10%) are unreported

Language Used for Initial Literacy Instruction in TWI Programs
As of December 2000

NATIONAL (n=248)
79 (31%) use minority language
49 (20%) use native language
54 (22%) use both languages
2 (1%) use English (both in same district)
35 (14%) N/A
29 (12%) unreported
In CALIFORNIA (n=84)
46 (53%) use minority language
4 (5%) use native language
13 (15%) use both languages
0 use English
16 (19%) N/A
7 (8%) unreported
In TEXAS (n=34)
14 (41%) use minority language
6 (18%) use native language
9 (26%)use both languages
0 use English
1 (3%) N/A
4 (12%) unreported
In NEW YORK (n=20)
1 (5%) use minority language
4 (20%) use native language
8 (40%) use both languages
0 use English
3 (15%) N/A
4 (20%) unreported

Return to ERIC Digest

Section 1:
Introductory Statistics
Section 2:
Program Model
and Literacy Instruction
Section 3:
NES Ethnicity
Section 4:
Economic Demographics
Section 5:
Demographic Comparison
Section 6:
Staffing